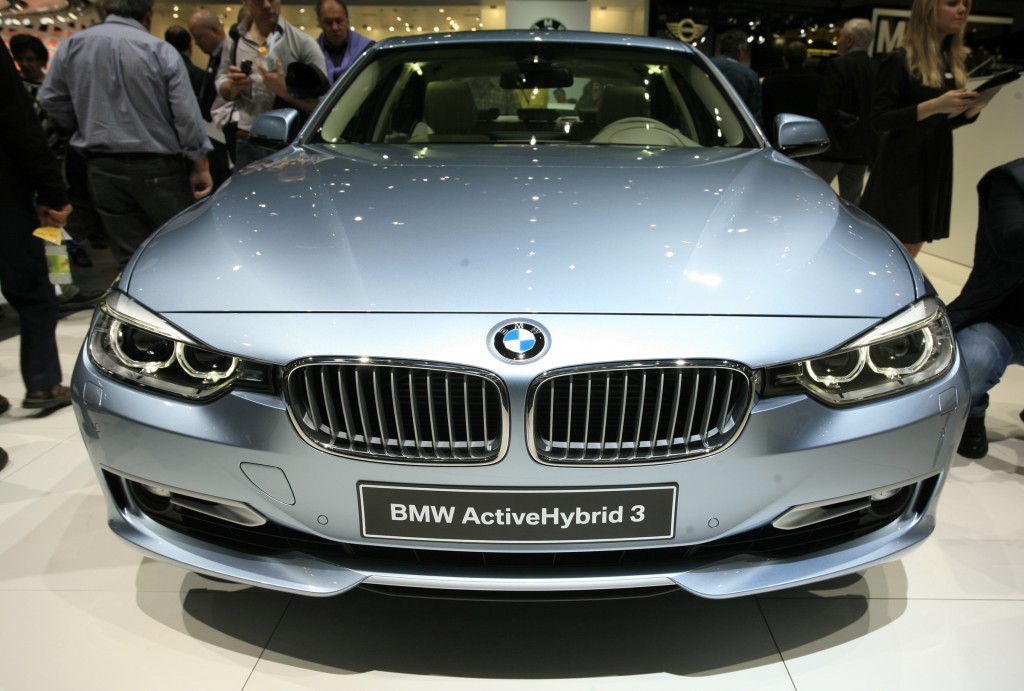
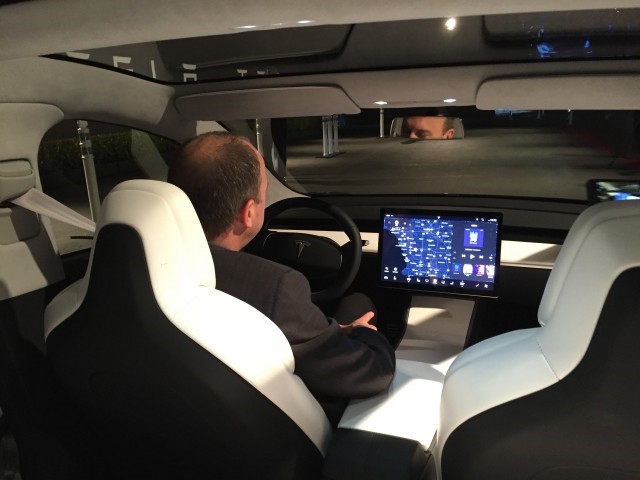
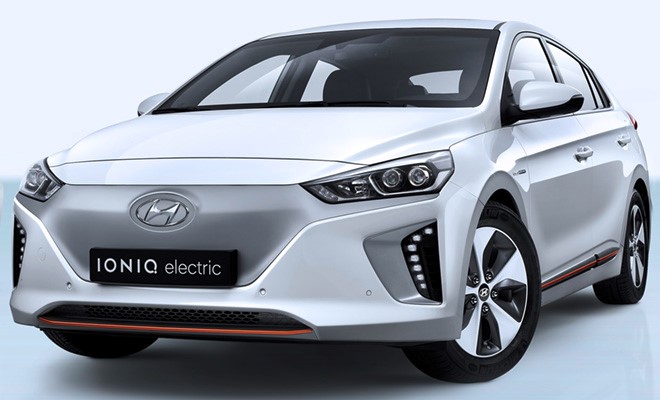


In many ways owning and driving an Electric Vehicle (EV) is a very different experience from a petrol or diesel vehicle and yet no different in other ways. Manufacturers are now releasing electric versions of their best selling models and selling them alongside their petrol and diesel versions. Best selling models such as the Golf, Focus are now being released as a full electric option, ending some motorists idea of electric cars being a 2 seater mini car only suitable for short city driving.
At present most manufacturers are releasing either a Hybrid or Electric model into their range. This can be seen as the manufacturers way of showing it’s capability within the sector and an indication of their intent for the future of the industry. Either way, the progression and development of the EV sector promotes the benefits of driving an electric vehicle while educating the public, unaware of it’s ability as a credible form of transport.
Below we show a comparison table for running an Electric Vehicle against a Petrol or Diesel equivalent.
An EV with a fuel efficiency of 150Wh/km (or 1.5L/100k or 188mpg) travelling an annual distance of 16,000km will produce the following annual fuel cost savings:
In terms of annual CO2 savings, the following savings will occur:
The Example below illustrates how these figures are derived. It is assumed that the Consumer is charging 100% of the time at their own Domestic location. Please note these figures are illustrative only and final figures will depend on usage, driving style, weather, energy prices and chosen electricity tariffs. |
| EV Fuel Cost Comparison Example | |||||||||||||||||||||||||||||||||||||||||||||||
|---|---|---|---|---|---|---|---|---|---|---|---|---|---|---|---|---|---|---|---|---|---|---|---|---|---|---|---|---|---|---|---|---|---|---|---|---|---|---|---|---|---|---|---|---|---|---|---|
Note:
|
| EV CO2 Emission Comparison Example | |||||||||||||||||||||||||||||||||||||||||||||
|---|---|---|---|---|---|---|---|---|---|---|---|---|---|---|---|---|---|---|---|---|---|---|---|---|---|---|---|---|---|---|---|---|---|---|---|---|---|---|---|---|---|---|---|---|---|
Notes: Based on SEAI “Energy in Ireland – 2009 Report” average electricity generation mix, note that this CO2 intensity will continue to fall as Ireland’s Renewable Electricity content rises from the value of 14.4% in 2009 to 40% by 2020 Information Source- SEAI |